QReports
The QNI project has already developed different proof-of-concept quantitative MRI reports.
| Cross-sectional dementia | |
 |
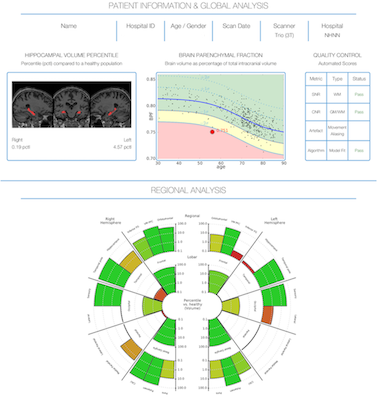
- T1-weighted MRI data post-processed with segmentation software tool GIF
- Whole brain and regional GM volumes presented for each subject
- Individual subject values were expressed as percentile estimates against a Gaussian distribution of normative GM volumes of c.500 healthy control subjects
- The graph at the top indicates the subject's whole-brain GM volume, and the ‘rose' plot below shows the percentile of the GM volume in each lobe and important sub-regions being normal (green) or significantly atrophied (red)
|
| Cross-sectional epilepsy | |
 |
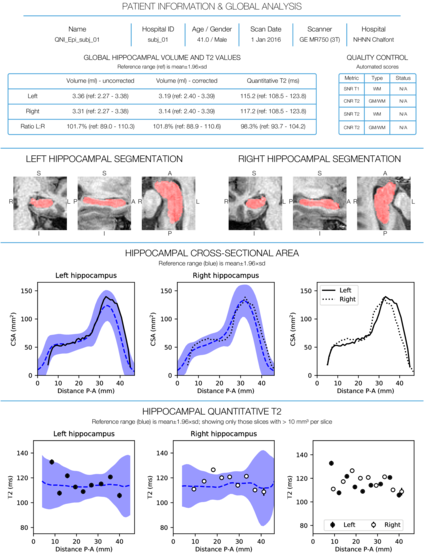
- Automated segmentation of the hippocampi using hipposeg
- Hipposeg: a multi-atlas-based segmentation algorithm (STEPS) with a template database of 400 manual segmentations
- T2 maps calculated for each voxel from the signal at two different TEs using a monoexponential fit
- Hippocampal volume and T2 relaxometry values for each subject presented in the context of a normative range derived from 115 control subjects
|
| Cross-sectional multiple sclerosis | |
 |
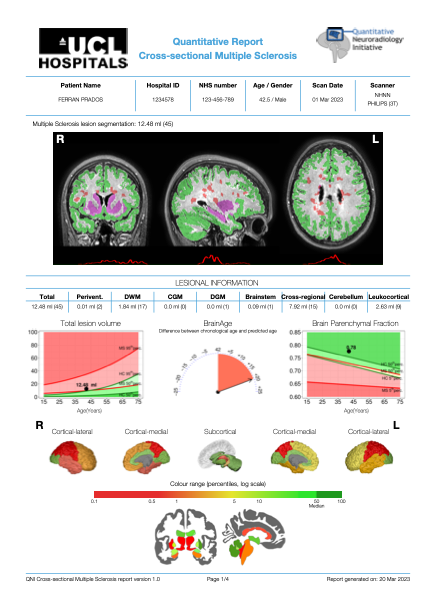
- FLAIR only MRI data post-processed with in-house segmentation software tool
- Lesional, whole brain and regional GM volumes presented for each subject
- Individual subject values are expressed as percentile estimates against a normative population of 1848 healthy control subjects from the MAGNIMS network and 847 people with MS from UCLH
- Estimated brain age in comparison to biological age
|
| And soon: cross-sectional glioma report, longitudinal dementia report, longitudinal multiple sclerosis report, cross-sectional parkison disease report and cross-sectional neuro-muscular diseases. | |